
Are you ready to take control of your website’s performance like a boss? You’ve come to the right place! Google Analytics is a game-changer for businesses of all shapes and sizes. It’s like having a digital crystal ball, giving you invaluable insights into your visitors’ behavior, preferences, and interaction with your website.
In today’s digital era, staying ahead of the competition means understanding your audience and making data-driven decisions. That’s where Google Analytics comes in. With its user-friendly interface and powerful data analysis tools, it’s an essential weapon in every marketer’s arsenal. Our Charleston SEO service optimizes your website based on the data we receive through Google Analytics and Search Console.
But let’s face it, diving into Google Analytics can feel like trying to decipher ancient hieroglyphics for the first time, and we all know how intimidating that can be. Fear not, dear reader! This comprehensive guide is designed with beginners in mind. By the end of this article, you’ll have a solid understanding of the basics, know the key metrics to track, and even learn how to set up goals for your website.
So, buckle up and let’s embark on this thrilling journey into the world of Google Analytics, where data meets strategy, and your website’s performance reaches new heights!
Getting Started with Google Analytics
Before we dive into the nitty-gritty, let’s get the ball rolling by setting up your Google Analytics account. Follow these simple steps, and you’ll be on your way to becoming a data-driven maestro in no time!
A. Creating a Google Analytics account
- Head to the Google Analytics website (google.com/analytics).
- Click on “Start for free” or sign in with your Google account.
- Follow the prompts to set up a new account, including entering your website’s name, URL, industry, and time zone.
B. Installing the tracking code on your website
- Once you’ve set up your account, Google Analytics will generate a tracking code for you.
- Copy the tracking code and paste it into the head section of every page on your website. This is like placing a digital detective on each page, reporting back on user behavior.
- For WordPress users, consider using a plugin like Google Analytics Dashboard for WP or MonsterInsights to make the process even easier.
- Save your changes and publish your updated website.
C. Navigating the Google Analytics interface
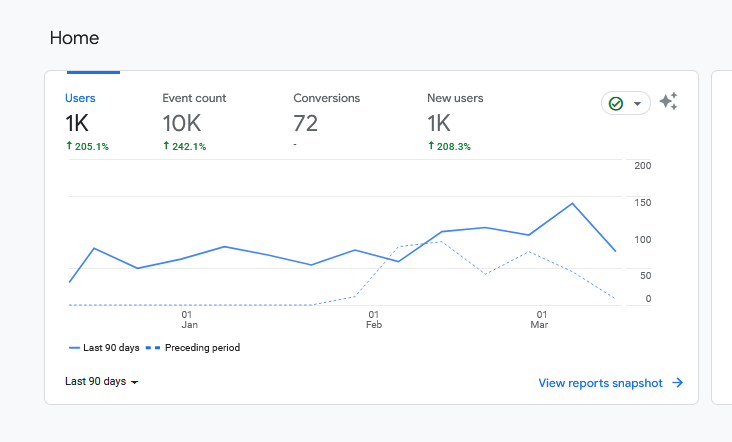
- After logging in, you’ll land on the Google Analytics home page. Here, you’ll find a snapshot of your website’s performance.
- On the left-hand side, you’ll see the main menu with various report categories, including Real-time, Audience, Acquisition, Behavior, and Conversions.
- Familiarize yourself with these categories by clicking through them and exploring the available reports.
Congratulations, your Google Analytics account is up and running! Now, the real fun begins. In the next sections, we’ll dive into the key metrics you need to know and how to use the data to supercharge your website’s performance. Stay tuned, fellow data enthusiasts!
Understanding Key Metrics
Now that you’ve set up Google Analytics, let’s unravel the mystery behind some of the most critical metrics you’ll encounter. Think of these metrics as the building blocks of your data-driven empire. With a solid grasp of these essential indicators, you’ll be well-equipped to decode your website’s performance and make informed decisions.
A. Users, Sessions, and Pageviews
- Users: These are the unique individuals visiting your website. Keep an eye on this number to gauge the overall reach of your online presence.
- Sessions: A session represents a user’s entire visit to your website, from the moment they arrive until they leave. This metric helps you understand how often users come to your site.
- Pageviews: This number reflects the total views of your site’s pages. If a user visits the same page multiple times, each visit counts as a separate pageview. A high number of pageviews can indicate engaging content or effective marketing efforts.
B. Bounce Rate and Exit Rate
- Bounce Rate: This percentage shows how many users leave your website after viewing just one page. A high bounce rate may indicate that your content isn’t meeting user expectations or that your site isn’t user-friendly.
- Exit Rate: This percentage reveals the frequency at which users leave your site from a specific page. Unlike bounce rate, exit rate considers users who have visited multiple pages before leaving. Use this metric to identify pages that may need improvement.
C. Average Session Duration and Pages per Session
- Average Session Duration: This metric represents the average time users spend on your website during a single session. The longer the duration, the more engaging your content might be.
- Pages per Session: This number indicates the average number of pages users view during a single session. A high pages per session value suggests that your site effectively encourages users to explore more content.
D. Customizing Your Dashboard for Easy Access to Important Metrics
- Click on “Customization” in the left-hand menu.
- Select “Dashboards” and click on “+New Dashboard.”
- Choose a layout and add widgets featuring the key metrics you want to monitor.
- Save your customized dashboard for quick and easy access to your most important data.
With a strong foundation in these key metrics, you’re well on your way to mastering Google Analytics. In the upcoming sections, we’ll explore how to use audience insights, acquisition analysis, goal-setting, and content evaluation to optimize your website’s performance.
Audience Insights

Understanding your audience is the secret sauce to a thriving online presence. With Google Analytics, you can dive deep into the demographics, interests, and behaviors of your website visitors. Let’s explore how to use these insights to tailor your content, marketing efforts, and user experience for maximum impact.
A. Demographics and Interests
- Age and Gender: Discover the age range and gender distribution of your users, and create content that resonates with your largest audience segments.
- Interests: Google Analytics offers insights into your users’ interests, such as hobbies and preferred product categories. Use this data to fine-tune your content and advertising strategies.
B. Geo-Location and Language
- Location: Identify where your users are coming from to target specific regions with localized content, promotions, or advertising campaigns.
- Language: Cater to your global audience by identifying the primary languages spoken by your users and offering translated content or multilingual support.
C. Technology and Mobile Usage
- Browser and Operating System: Monitor the browsers and operating systems your users prefer, and ensure your website is compatible with the most popular choices.
- Mobile vs. Desktop: Determine the percentage of users visiting your site from mobile devices versus desktop computers. Use this data to optimize your website for a seamless mobile experience.
D. Using Audience Data to Improve Website Performance
- Personalize Content: Tailor your content to match the preferences and needs of your largest audience segments, increasing engagement and user satisfaction.
- Optimize User Experience: Analyze user behavior data, such as navigation paths and time spent on specific pages, to identify areas for improvement and enhance your website’s user experience.
- Refine Marketing Strategies: Use audience insights to target advertising campaigns more effectively, reaching the right users with the right message.
Armed with a wealth of audience insights, you’re now ready to fine-tune your website for maximum impact. In the next sections, we’ll tackle acquisition analysis, goal-setting, and content evaluation, further elevating your Google Analytics expertise. Keep up the great work, data aficionados!
Acquisition Analysis
Knowing how users find your website is crucial for optimizing your marketing efforts and driving growth. Acquisition analysis in Google Analytics helps you uncover the sources that bring traffic to your site, allowing you to identify the most effective channels and strategies. Let’s dive into the various aspects of acquisition analysis and learn how to capitalize on this valuable data. As stated in this article, you can browse your selection of available deals on smartphones and top brands and explore the service plans that best suit your needs.
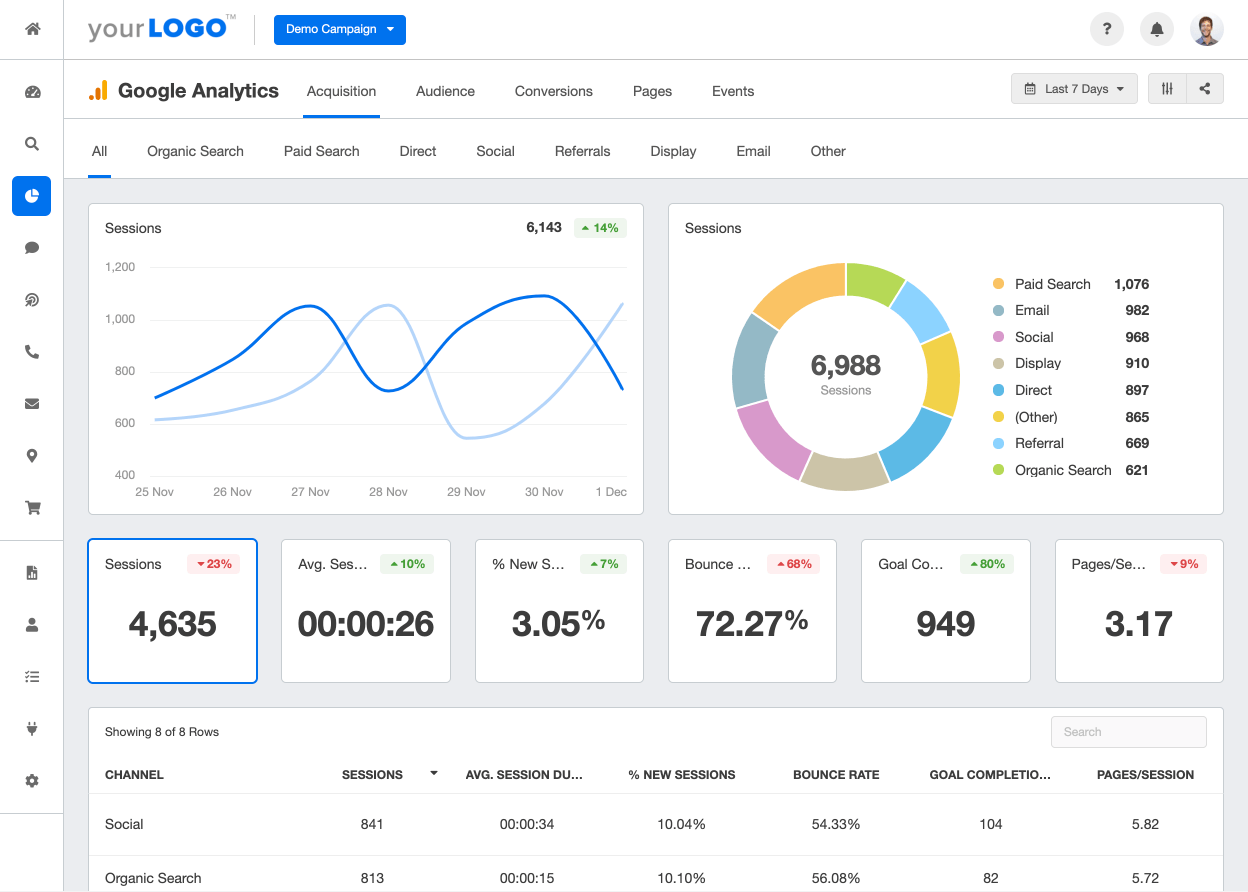
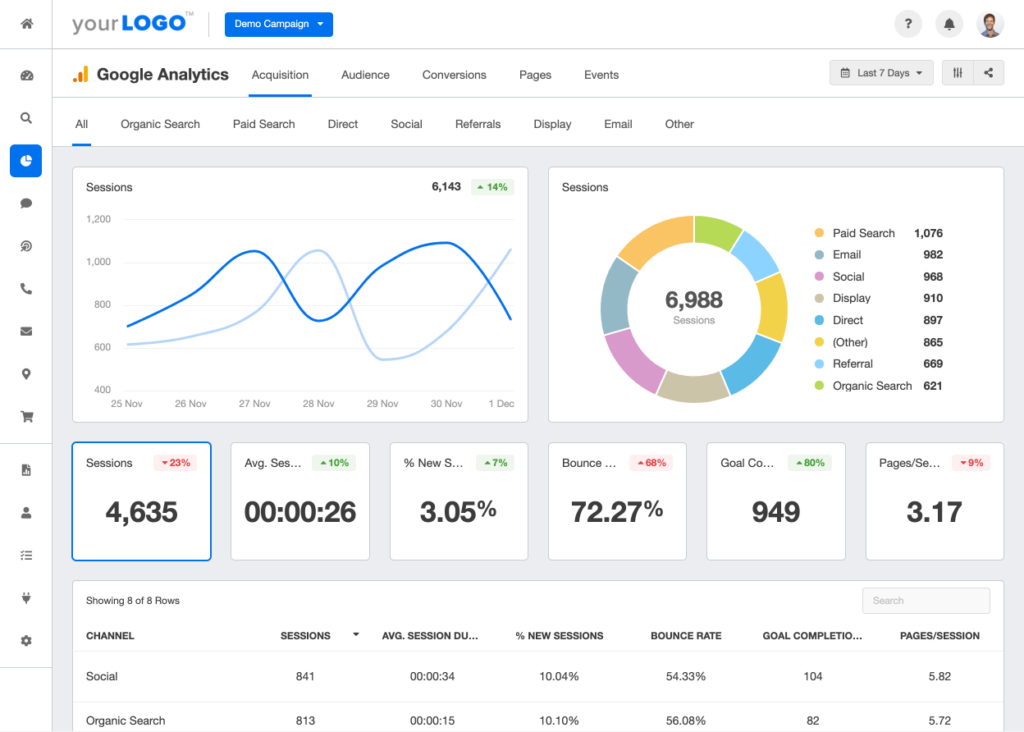
A. Channels, Source, and Medium
- Channels: This report groups your traffic into predefined categories, such as Organic Search, Direct, Social, and Referral. Analyze these channels to identify the strongest traffic drivers and areas for improvement.
- Source: The source report shows the origin of your traffic, such as a search engine, social media platform, or a specific website. Use this data to determine the most valuable traffic sources for your site.
- Medium: The medium report categorizes the general type of traffic, such as “organic” (unpaid search), “referral” (links from other sites), or “cpc” (cost-per-click). Analyzing the medium can help you evaluate the effectiveness of your marketing strategies.
B. Referral Traffic and Organic Search
- Referral Traffic: This report displays the external websites that are directing users to your site. Pinpoint high-quality referral sources and consider forming partnerships or collaborations to boost traffic even more.
- Organic Search: Uncover the search terms users are typing into search engines to find your website. Utilize this information to improve your SEO strategy and create content that aligns with your audience’s search intent.
C. Social Media and Email Marketing Insights
- Social Media: Discover which social media platforms drive the most traffic to your site. Use this data to focus your social media marketing efforts on the most impactful platforms.
- Email Marketing: If you’ve set up email campaign tracking, analyze the performance of your email marketing efforts. Use this data to refine your email campaigns, improving open rates, click-through rates, and conversions.
D. Identifying High-Performing Traffic Sources
- Compare Engagement Metrics: Analyze the bounce rate, pages per session, and average session duration for each traffic source to determine which ones are the most engaged.
- Track Conversions: Monitor the conversion rates for each traffic source to identify the ones that drive the most valuable actions on your site.
By understanding how users find your website and which sources drive the most valuable traffic, you can optimize your marketing strategies for maximum impact. In the next sections, we’ll explore setting goals and conversions, as well as evaluating your website’s content. Stay sharp, data wizards!
Setting Goals and Conversions
Measuring the success of your website goes beyond just tracking traffic and engagement. It’s essential to monitor the specific actions users take that contribute to your business objectives. In Google Analytics, setting up goals allows you to track conversions and measure the effectiveness of your website in driving desired outcomes. Let’s dive into defining SMART goals and setting them up in Google Analytics.
A. Defining SMART Goals
- Specific: Clearly define the action you want users to take, such as signing up for a newsletter or making a purchase.
- Measurable: Ensure your goal is quantifiable, allowing you to track progress and success.
- Achievable: Set realistic targets based on your website’s current performance and industry benchmarks.
- Relevant: Align your goals with your business objectives and overall marketing strategy.
- Time-bound: Establish a timeframe to achieve your goals, helping you stay focused and on track.
B. Setting Up Goals in Google Analytics
- Navigate to the “Admin” tab in your Google Analytics account and select “Goals” under the “View” column.
- Click on “+ New Goal” and choose from the pre-defined templates or create a custom goal.
- Configure the goal details, such as the type (destination, duration, pages/screens per session, or event) and the specific conditions that define a conversion.
- Save your goal and monitor its progress in the “Conversions” reports.
C. Analyzing Goal Performance and Conversion Rates
- Monitor your goals’ conversion rates to assess the effectiveness of your website in driving desired actions.
- Identify high and low-performing traffic sources, marketing campaigns, and content in driving conversions.
- Analyze the “Funnel Visualization” and “Goal Flow” reports to uncover potential obstacles or drop-off points in your conversion funnel.
D. Optimizing Your Website for Conversions
- Implement A/B testing on key pages, such as landing pages or checkout pages, to identify improvements that boost conversion rates.
- Optimize your calls-to-action, headlines, and content structure based on insights from your goal performance data.
- Enhance user experience and website navigation to guide users smoothly through the conversion process.
By setting goals and tracking conversions, you’ll gain invaluable insights into your website’s ability to drive business results. Keep refining your strategies and optimizing your site to maximize conversions and achieve your objectives. You’re now a Google Analytics pro, data warriors!
Behavior Flow and Content Analysis
A website’s success is closely tied to the quality and effectiveness of its content. Google Analytics provides invaluable insights into user behavior, allowing you to identify high-performing and underperforming content, as well as opportunities to enhance user experience and website navigation. Let’s explore how to use behavior flow and content analysis to optimize your website.
A. Understanding the Behavior Flow Report
- The Behavior Flow report visually represents the paths users take as they navigate through your site. This helps you identify the most common user journeys and potential bottlenecks.
- Use this report to pinpoint popular entry points, frequently visited pages, and common exit points, which can inform your content and navigation strategy.
B. Identifying High-Performing and Underperforming Content
- Review the “All Pages” report under the Behavior tab to analyze pageviews, unique pageviews, average time on page, and bounce rate for each page on your site. Measuring the success of your content is key to your seo success.
- High-Performing Content: Identify pages with high traffic, low bounce rates, and longer average time on page. These pages likely resonate with your audience, and you can use them as a model for future content.
- Underperforming Content: Spot pages with low traffic, high bounce rates, or short average time on page. Consider updating, repurposing, or removing these pages to improve overall site performance.
C. Implementing Changes Based on Data-Driven Insights
- Optimize Underperforming Content: Update headlines, meta descriptions, or content structure to boost SEO and user engagement. Incorporate relevant keywords and ensure the content aligns with user search intent.
- Enhance Navigation: Improve site navigation by adding clear calls-to-action, internal links, or updating your menu structure based on popular user paths identified in the Behavior Flow report.
D. Enhancing User Experience and Website Navigation
- Mobile Optimization: Review the “Mobile Overview” report under the Audience tab to ensure your site provides a seamless experience for mobile users.
- Site Speed: Analyze the “Site Speed” report under the Behavior tab to identify slow-loading pages and implement recommended improvements, such as optimizing images or enabling browser caching.
By leveraging behavior flow and content analysis data, you can make informed decisions to optimize your website’s performance and user experience. Keep refining your content strategy and navigation based on these insights to ensure continued success in the ever-evolving digital landscape.
Conclusion
Congratulations, data aficionados! You’ve made it through our comprehensive guide to mastering Google Analytics for beginners. By now, you should have a solid understanding of how to set up your account, navigate the platform, and analyze key metrics to optimize your website’s performance.
Let’s recap some of the key takeaways from our journey:
- Set up Google Analytics correctly to ensure accurate and reliable data collection.
- Familiarize yourself with essential metrics to assess your website’s performance and user engagement.
- Leverage audience insights to tailor content, marketing efforts, and user experience for maximum impact.
- Analyze acquisition data to identify high-performing traffic sources and optimize marketing strategies.
- Define and track SMART goals to measure your website’s effectiveness in driving conversions.
- Utilize behavior flow and content analysis to improve user experience, navigation, and content quality.
As you continue to explore Google Analytics, remember that this powerful tool offers a wealth of information to help you make data-driven decisions. Stay curious, keep experimenting, and never stop learning. Your website’s success is now in your hands, and with the insights provided by Google Analytics, there’s no limit to what you can achieve.


