

In today’s fast-paced world, making data-driven decisions is the key to success. But let’s face it, Google Analytics can sometimes feel like a maze of metrics and numbers. That’s where custom dashboards come in, ready to save the day!
Custom dashboards are a powerful feature in Google Analytics that help you supercharge your data analysis. By organizing the most relevant information in one place, you can easily track your website’s performance and uncover valuable insights. Plus, you’ll have more time to do what you love, like trying that new taco place downtown (yum!). Google Analytics is a great tool for improving your SEO, and should be heavily utilized.
In this blog, we’ll guide you through the process of creating and mastering Google Analytics custom dashboards. So, buckle up and get ready to become a data wizard. You’ll be impressing your colleagues and making smarter decisions in no time!
The Basics of Google Analytics Custom Dashboards

Before we dive into the nitty-gritty, let’s cover the basics. A custom dashboard is a personalized view of your Google Analytics data, tailored to your needs. Imagine it as a control panel where you can easily access the most relevant metrics for your business. And the best part? It’s fully customizable!
Here are some key benefits of using custom dashboards:
- Save Time: No more clicking around and getting lost in a sea of data. Custom dashboards streamline your analysis, allowing you to focus on the metrics that matter most.
- Stay Focused: By displaying only the data you need, custom dashboards help you stay focused on your goals and make informed decisions.
- Share Insights: Custom dashboards can be shared with your team members, fostering collaboration and ensuring everyone is on the same page.
- Monitor Progress: By tracking essential metrics over time, you can easily measure the effectiveness of your strategies and make adjustments as needed.
In summary, custom dashboards are like your personal data concierge, catering to your every analytical whim. Now that we’ve covered the basics, let’s move on to the fun part: creating your very own custom dashboard!
Setting Up Your First Custom Dashboard
Alright, it’s time to roll up our sleeves and create your first custom dashboard. Don’t worry, it’s easier than assembling that new office chair! Just follow these simple steps:
- Log in to your Google Analytics account and navigate to the property you want to work with.
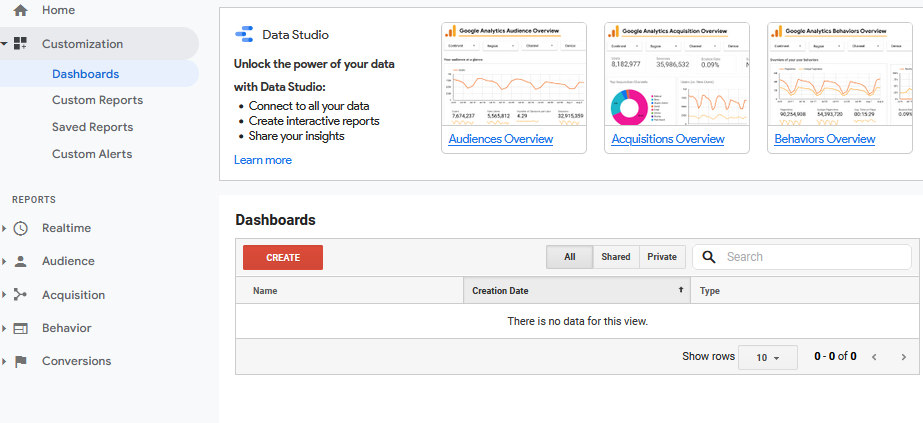
- In the left sidebar, click on “Customization” and then “Dashboards.” Welcome to the dashboard zone!
- Click on the “+New Dashboard” button. A pop-up window will appear, asking you to choose between “Blank Canvas” and “Starter Dashboard.” The choice is yours, but for now, let’s go with “Blank Canvas” to create a dashboard from scratch.
- Give your dashboard a descriptive name, like “Website Performance Overview” or “Taco Sales Tracker” (if you’re really into tacos).
- Click “Create Dashboard.” Voilà! You’ve just set up a blank custom dashboard, ready to be filled with widgets displaying your favorite metrics.
Remember, practice makes perfect. Feel free to play around and experiment as you set up your custom dashboard. In the next section, we’ll dive into the exciting world of widgets and teach you how to customize them like a pro. Stay tuned!
Adding and Customizing Widgets
Widgets are the building blocks of your custom dashboard, displaying bite-sized pieces of data tailored to your needs. Let’s explore how to add and customize them like the data rockstar you are!
- In your custom dashboard, click on “+ Add Widget.” This will open a new window where you can select the widget type and configure its settings.
- Choose a widget type that fits your needs. Here’s a quick rundown of your options:
- Metric: Displays a single numeric value.
- Timeline: Shows data trends over time.
- Geomap: Visualizes geographical data.
- Table: Presents data in a tabular format.
- Pie: Compares proportions of different values.
- Bar: Represents data using horizontal bars.
- Configure your widget settings. Depending on the widget type, you can choose the metric(s) to display, apply filters, and customize the look and feel. For example, if you’re creating a table widget, you can select the dimensions and metrics to include, as well as the number of rows to display.
- Give your widget a clear and concise title, like “Top Traffic Sources” or “Average Session Duration.”
- Click “Save” to add the widget to your custom dashboard. You can now arrange your widgets by dragging and dropping them to your preferred position.
Don’t be afraid to get creative and experiment with different widget types and settings! The goal is to create a custom dashboard that tells your data story in the most effective way possible. And remember, you can always edit or delete widgets later if you want to make changes or try something new. Happy customizing!
Using Custom Dashboard Templates
Feeling overwhelmed? Don’t sweat it! Custom dashboard templates are here to save the day. These pre-built dashboards are designed to address specific needs, offering a quick and easy way to jumpstart your data analysis. Let’s dive into the world of templates!
- To access templates, click on “+New Dashboard” in the “Dashboards” section, just like before. But this time, select “Starter Dashboard” instead of “Blank Canvas.”
- Browse the available templates, ranging from “SEO Dashboard” to “Social Media Overview.” Each template comes with a set of pre-configured widgets tailored to a specific use case.
- Select a template that matches your needs and click “Create Dashboard.” You can now customize the dashboard by adding, removing, or editing widgets as needed.
- Don’t forget to give your dashboard a unique and descriptive name, like “E-commerce Performance” or “Content Engagement Metrics.”
In addition to Google’s built-in templates, you can find a treasure trove of user-generated templates online. Many experts share their custom dashboards on blogs, forums, and social media, so keep an eye out for inspiration!
Using custom dashboard templates is like having a cheat sheet for your data analysis. They offer a solid starting point, but don’t hesitate to tweak and personalize them to fit your unique business needs. Happy templating!
Essential Custom Dashboard Examples
Now that you’re familiar with custom dashboards, let’s explore some examples that every data-driven marketer should consider. These dashboards cover a range of essential topics and can serve as a great starting point for your own creations:
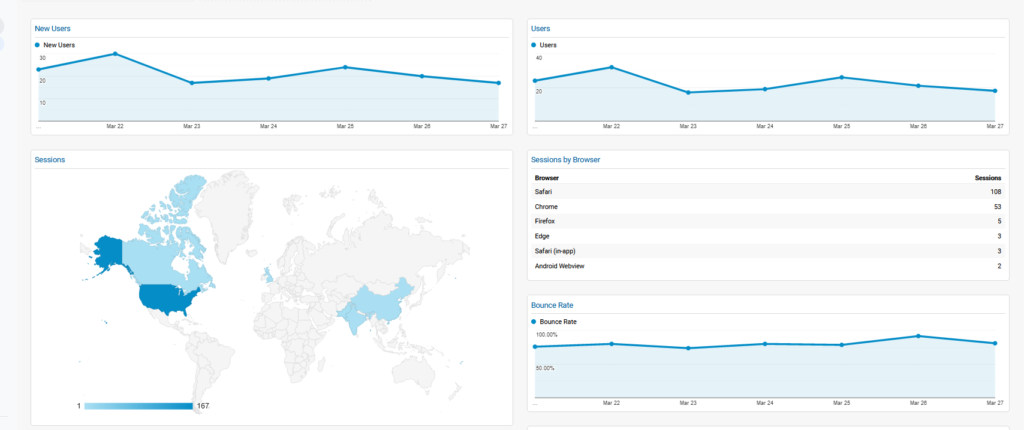
- Website Performance Dashboard:
- Pageviews and unique visitors
- Bounce rate and average session duration
- Top traffic sources and channels
- Most viewed pages and top exit pages
- SEO Dashboard:
- Organic search traffic and top keywords
- Landing pages with the highest traffic from organic search
- CTR (click-through rate) and average position for top search queries
- Pages with the highest number of backlinks
- Social Media Dashboard:
- Social media traffic and top referral sources
- Most shared content and top-performing posts
- Social media conversions and goal completions
- Engagement metrics like comments, likes, and shares
- E-commerce Dashboard:
- Total revenue and transactions
- Conversion rate and average order value
- Top-selling products and product categories
- Sales by traffic source and marketing channel
Remember, these examples are just a starting point. Feel free to mix and match widgets, add new ones, or remove those that don’t apply to your business. The beauty of custom dashboards lies in their flexibility, so don’t hesitate to tailor them to your unique needs and goals.
With these essential custom dashboard examples in your toolkit, you’ll be well-equipped to supercharge your data analysis and make data-driven decisions like a pro!
Sharing and Collaborating on Custom Dashboards
Data analysis isn’t a solo sport. Sharing and collaborating on custom dashboards can help your team stay aligned, informed, and efficient. Ready to spread the data love? Follow these simple steps:
- To share a custom dashboard, click the “Share” button located at the top of the dashboard screen. You’ll see three sharing options:
- Share template link: This option generates a link to your dashboard template, allowing others to create a copy of it in their own Google Analytics account. Note that this won’t include your actual data, just the dashboard structure.
- Share in an email: This lets you send a snapshot of your dashboard via email, either as a one-time message or on a recurring schedule (e.g., daily, weekly, monthly). You can also customize the email subject, message, and recipients.
- Share dashboard: This generates a shareable link to your live custom dashboard. Recipients will need access to your Google Analytics account to view the data.
- Collaborate with team members by granting them access to your Google Analytics account. To do this, navigate to the “Admin” section and click on “User Management” under the relevant account, property, or view. From there, you can add users and set their permissions (e.g., Read & Analyze, Edit, Collaborate).
- Encourage your team to provide feedback and suggest improvements to your custom dashboards. The more eyes on your data, the better! Foster a culture of data-driven decision-making by involving your team in the process.
Sharing and collaborating on custom dashboards can turn your data analysis into a team effort, ensuring everyone is on the same page and working towards the same goals. So go ahead, share the data love and watch your team’s productivity soar!
Pro Tips and Tricks for Custom Dashboards
Ready to take your custom dashboard game to the next level? Check out these pro tips and tricks to make your data analysis even more powerful and efficient:
- Keep it simple: Don’t overcrowd your dashboard with too many widgets. Focus on the most important metrics and insights that drive your decision-making. Remember, quality trumps quantity!
- Use filters strategically: Apply filters to your widgets to narrow down your data and highlight specific segments, like traffic from a certain location or device type. This can help you uncover valuable insights and trends.
- Segment, segment, segment: Leverage Google Analytics segments to compare different subsets of your data, like new vs. returning visitors or paid vs. organic traffic. This can provide deeper insights and help you spot opportunities for optimization.
- Set goals and alerts: Use Google Analytics goals to track specific actions and conversions, then create custom alerts to notify you when there are significant changes in your data. This way, you can react quickly and make data-driven decisions in real-time.
- Make use of annotations: Add annotations to your timeline widgets to mark important events, like the launch of a marketing campaign or a website update. This can help you put your data into context and better understand the impact of your actions.
- Stay organized: Group related widgets together to create a logical flow and make your dashboard easier to read. For example, you might want to cluster all social media widgets or all e-commerce widgets in a specific area of your dashboard.
With these pro tips and tricks up your sleeve, you’ll be well on your way to becoming a custom dashboard ninja. Remember, practice makes perfect, so keep experimenting and fine-tuning your dashboards to unlock the full potential of your data. Good luck, and happy analyzing!
Final Thoughts
In conclusion, Google Analytics custom dashboards are an indispensable tool for any data-driven marketer. They enable you to streamline your data analysis, focus on the most important metrics, and make informed decisions that drive success. If you’d like some Charleston SEO professionals do the dirty work for you, give us a call at (843) 410-4317!
By mastering the basics of custom dashboards, setting up your first one, and exploring different widgets and templates, you’ll quickly become a data analysis pro. Don’t forget to share your dashboards with your team, collaborate on insights, and use our pro tips and tricks to level up your skills even further.
With persistence, creativity, and a data-driven mindset, you’ll soon discover the true power of custom dashboards in your marketing strategy. So go ahead, supercharge your data, and watch your marketing efforts soar to new heights!


