
If you’ve already dipped your toes into the world of Google Analytics and are eager to dive deeper, you’re in the right place. With the vast array of features and insights available, Google Analytics offers advanced techniques that can help you uncover even more valuable data and make well-informed decisions for your website and business.
In this article, we’ll explore some powerful Google Analytics techniques that will elevate your data analysis skills and help you unlock the platform’s full potential. From advanced segmentation and multi-channel funnel analysis to custom reports and enhanced e-commerce tracking, we’ll guide you through each technique to ensure you have a solid grasp of these advanced capabilities.
But why stop there? We’ll also discuss the integration of Google Analytics with other tools, such as Google Search Console, Google Ads, and various data visualization platforms. By the time you finish this article, you’ll be well-equipped to make the most of Google Analytics and drive your website’s performance to new heights. We have previously gone over Google Analytics tips for beginners, so make sure to check that out first!
Advanced Segmentation
Segmentation is a powerful method to break down your website’s data into smaller, more manageable pieces. By applying advanced segmentation techniques in Google Analytics, you can uncover hidden patterns, identify trends, and make more informed decisions for your website and business. Let’s explore the world of advanced segmentation and learn how to apply it effectively.
A. Benefits of Segmenting Data
- More precise analysis: Segmentation helps you focus on specific subsets of data, allowing for a more detailed understanding of user behavior.
- Identifying trends and patterns: Segments can reveal trends and patterns that may be concealed within the aggregated data.
- Personalization and targeting: By understanding different user segments, you can tailor your content, marketing efforts, and user experience to better target specific groups.
B. Creating Custom Segments
- Google Analytics offers several predefined segments, such as traffic source, device type, and user demographics. However, to dive deeper into your data, you may need to create custom segments.
- To create a custom segment, navigate to any report and click on “Add Segment.” Then, select “+ New Segment” and configure your segment by applying filters based on dimensions, metrics, or user behavior.
- Save your custom segment and apply it to any report in Google Analytics to analyze the data specific to that segment.
C. Examples of Advanced Segments to Analyze
- High-Value Customers: Segment users based on factors such as lifetime value, average order value, or purchase frequency to identify your most valuable customers and target them effectively.
- Abandoned Carts: Analyze users who added items to their shopping cart but did not complete the purchase, and identify potential barriers or opportunities for improvement.
- Engaged Users: Segment users based on engagement metrics, such as time on site or pages per session, to understand what drives users to engage with your content and replicate those strategies across your site.
By harnessing the power of advanced segmentation in Google Analytics, you can unlock deeper insights into your website’s performance and user behavior. Keep experimenting with different segments to discover new opportunities for growth and optimization. Happy segmenting, data explorers!
Multi-Channel Funnels
In today’s complex digital landscape, users often interact with multiple marketing channels before converting. To fully understand the customer journey and the role each channel plays, Google Analytics offers Multi-Channel Funnels. By analyzing these funnels, you can gain valuable insights into the interactions between various marketing channels and optimize your Charleston SEO. Let’s dive into Multi-Channel Funnels and learn how to make the most of this powerful tool.
A. Understanding the Customer Journey
- The customer journey often involves multiple touchpoints across different channels, such as organic search, social media, and email marketing.
- Multi-Channel Funnels in Google Analytics provide visibility into how these channels work together to drive conversions and help you make informed decisions on marketing spend and channel prioritization.
B. Analyzing Assisted Conversions
- Assisted conversions are the number of times a marketing channel contributed to a conversion without being the final touchpoint.
- The Assisted Conversions report in Google Analytics displays the assisted conversions and conversion value for each channel, highlighting the channels that play a crucial role in the conversion process, even if they don’t directly result in a conversion.
- Use assisted conversion data to better allocate resources and optimize channels that may not appear as effective when only considering last-touch attribution.
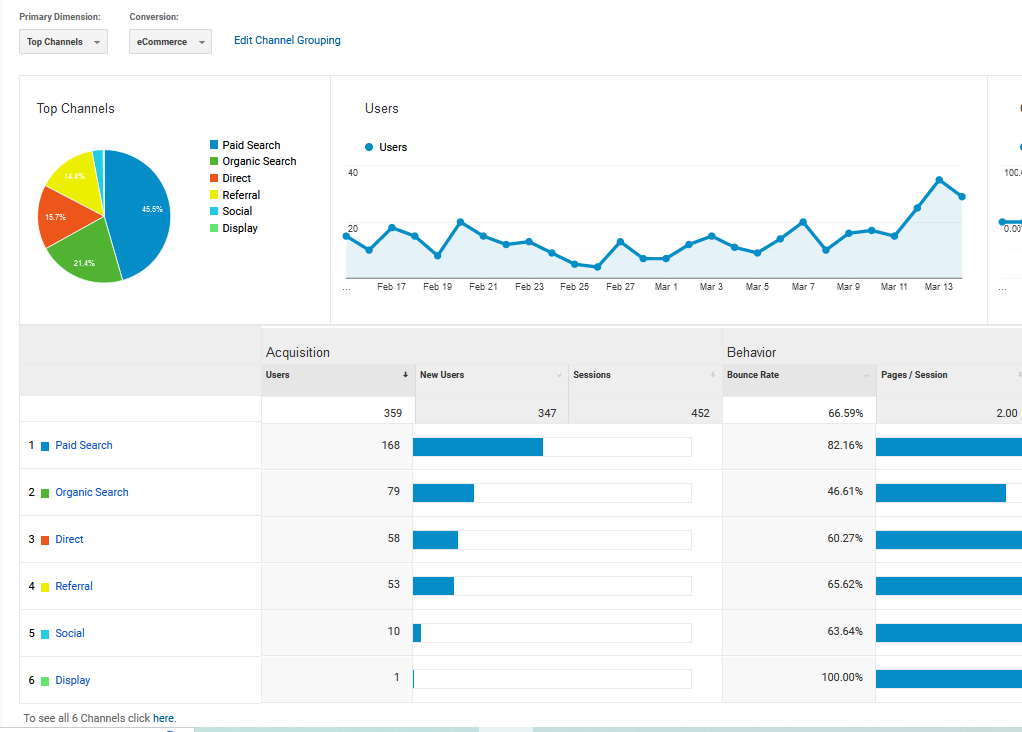
C. Evaluating the Performance of Marketing Channels
- The Top Conversion Paths report shows the most common sequences of channel interactions that led to conversions, providing insights into the typical customer journey.
- The Time Lag report reveals the time it takes for users to convert after their first interaction with your marketing channels, helping you understand the length of your sales cycle and adapt your marketing strategies accordingly.
- The Path Length report shows the number of touchpoints users interact with before converting, shedding light on the complexity of your customer journey.
By leveraging Multi-Channel Funnels in Google Analytics, you can gain a more holistic understanding of your marketing channels’ effectiveness and adapt your strategies for maximum impact. Keep analyzing and optimizing your channels based on these insights, and watch your website’s performance reach new heights. Multi-Channel Funnel mastery, here we come!
Attribution Modeling
Attribution modeling is a powerful approach to understanding the impact of your marketing channels on conversions. By assigning credit to various touchpoints in a user’s journey, attribution models allow you to see which channels contribute the most to your desired outcomes. Let’s delve into the world of attribution modeling and learn how to harness this advanced technique in Google Analytics.
A. Introduction to Attribution Models
- What is an attribution model? An attribution model is a rule or set of rules that determines how credit for conversions is assigned to different touchpoints in a user’s journey.
- Importance of Attribution Models: By understanding the value of each marketing channel, you can optimize your marketing efforts, allocate resources effectively, and maximize ROI.
B. Comparing Different Attribution Models
- Google Analytics provides several predefined attribution models, such as: a. Last Interaction: Credits the final touchpoint before conversion. b. First Interaction: Credits the initial touchpoint in the user’s journey. c. Linear: Allocates equal credit to all touchpoints in the user’s journey. d. Time Decay: Credits touchpoints closer to the conversion more heavily. e. Position-Based: Assigns more credit to the first and last touchpoints while distributing the remaining credit among other touchpoints.
- The Model Comparison Tool in Google Analytics allows you to compare the performance of different attribution models and see how each model impacts the value of your marketing channels.
C. Customizing Attribution Models to Fit Your Business
- Every business is unique, and predefined attribution models may not perfectly represent your marketing efforts. Google Analytics allows you to create custom attribution models that align with your specific needs.
- Customize your attribution model by adjusting the lookback window, selecting touchpoint types, and applying custom credit rules based on factors like time, position, or engagement.
- Regularly review and adjust your custom attribution model as your marketing strategies evolve to ensure accurate representation of your efforts.
By leveraging attribution modeling in Google Analytics, you can gain a deeper understanding of how your marketing channels contribute to conversions and optimize your efforts accordingly. Keep experimenting with different models and customizations to find the best fit for your business, and watch your website performance soar. Attribution modeling mastery, here we come!
Custom Reports and Dashboards
Google Analytics offers a wealth of data, but sometimes the standard reports don’t provide the exact insights you need. That’s where custom reports and dashboards come in! By creating tailored reports and organizing them in a convenient dashboard, you can focus on the metrics that matter most to your business. Let’s delve into custom reports and dashboards, and learn how to make the most of these powerful features.
A. Benefits of Custom Reports and Dashboards
- Customization: Create reports that focus on the specific dimensions and metrics relevant to your business goals.
- Efficiency: Dashboards provide a centralized location for your most important reports, allowing you to monitor key metrics at a glance.
- Sharing: Easily share custom reports and dashboards with team members for improved collaboration and decision-making.
B. Creating Custom Reports for Specific Analysis
- To create a custom report, navigate to the “Customization” tab in Google Analytics and click on “Custom Reports.” Then, click “+ New Custom Report.”
- Select the report type (Explorer, Flat Table, or Map Overlay) based on your desired visualization.
- Define the dimensions and metrics you want to include in your custom report, and apply any necessary filters.
- Save your custom report and access it from the “Customization” tab at any time.
C. Building and Sharing Custom Dashboards
- To create a custom dashboard, navigate to the “Customization” tab and click on “Dashboards.” Then, click “+ New Dashboard.”
- Choose between a blank canvas or a starter dashboard, and customize the layout to fit your preferences.
- Add widgets to your dashboard by selecting the report type, dimensions, and metrics. You can also add real-time, standard, and custom report widgets.
- Share your custom dashboard with team members by clicking on “Share” and selecting “Share Object.” This will provide a link to your dashboard that can be accessed by anyone with the link.
By harnessing the power of custom reports and dashboards in Google Analytics, you can focus on the data that matters most to your business, improve efficiency, and foster better collaboration. Keep experimenting with different report configurations and dashboard layouts to find the perfect setup for your needs. Custom reporting and dashboard mastery, here we come!
Advanced Event Tracking
Event tracking is a crucial technique to measure user interactions with your website’s content, such as button clicks, form submissions, or video plays. By implementing advanced event tracking with Google Tag Manager, you can gain a deeper understanding of how users engage with your site and use these insights to optimize your content and user experience. Let’s explore advanced event tracking and learn how to make the most of this powerful tool.
A. Importance of Tracking User Interactions
- Better understanding of user behavior: Event tracking provides valuable data on how users interact with your content and what actions they take on your site.
- Content optimization: By identifying the most engaging content, you can replicate its success and improve less engaging elements.
- Conversion rate optimization: Analyzing event data can help you identify potential barriers to conversion and implement necessary changes to improve user experience.
B. Setting up Event Tracking with Google Tag Manager
- Google Tag Manager (GTM) simplifies the process of implementing event tracking without the need for manual coding.
- To set up event tracking, create a new tag in GTM, choose the “Universal Analytics” tag type, and configure the tag to track a specific event, such as a button click or form submission.
- Add a trigger to your tag to define when the event should be tracked, such as when a user clicks on a specific button or submits a form.
- Publish your changes in GTM and verify that the events are being tracked correctly in Google Analytics.
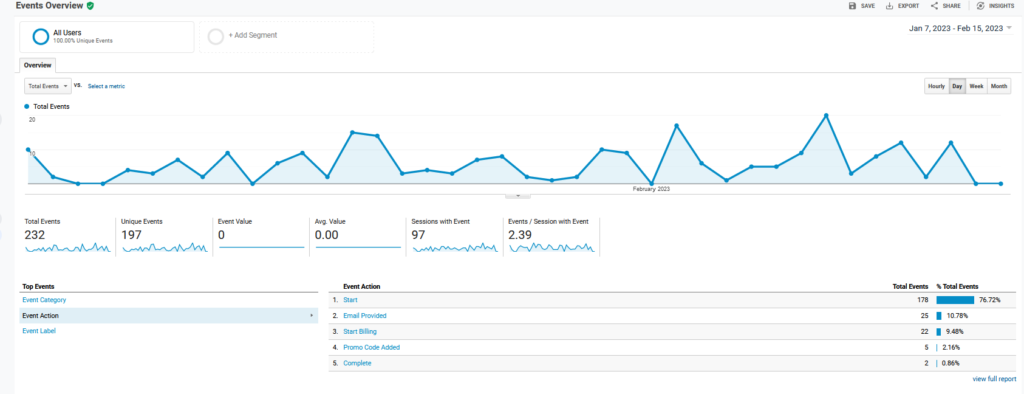
C. Analyzing Event Data for Insights
- The “Events” report in Google Analytics provides an overview of the tracked events, allowing you to analyze the data by event category, action, or label.
- Use event data to identify trends in user behavior, such as the most clicked buttons or the most watched videos on your site.
- Apply advanced segmentation to your event data to gain deeper insights into specific user groups and their interactions with your content.
By leveraging advanced event tracking in Google Analytics, you can uncover valuable insights into user behavior and use this knowledge to optimize your content and user experience. Keep experimenting with different event tracking setups to discover new opportunities for growth and improvement. Advanced event tracking mastery, here we come!
Enhanced E-commerce Tracking
If you run an e-commerce website, understanding your customers’ shopping behavior is crucial to optimizing your online store and driving sales. Enhanced E-commerce Tracking in Google Analytics provides detailed insights into the customer journey, from product discovery to purchase. Let’s dive into Enhanced E-commerce Tracking and learn how to unlock its full potential for your online store.
A. Benefits of Enhanced E-commerce Tracking
- In-depth insights: Gain a deeper understanding of user behavior, product performance, and the effectiveness of your marketing campaigns.
- Data-driven decisions: Use data from Enhanced E-commerce Tracking to make informed decisions on product offerings, promotions, and website improvements.
- Improved conversion rates: Identify and address potential barriers to conversion by analyzing the customer journey and optimizing the shopping experience.
B. Implementing Enhanced E-commerce Tracking
- Enable Enhanced E-commerce Tracking in Google Analytics by navigating to your view settings and turning on the “Enable Enhanced Ecommerce Reporting” option.
- Use Google Tag Manager (GTM) to simplify the implementation process by creating and configuring tags and triggers for each step of the customer journey.
- Test your Enhanced E-commerce Tracking setup to ensure accurate data collection and troubleshoot any issues.
C. Analyzing Enhanced E-commerce Data for Optimization
- The “Ecommerce” reports in Google Analytics provide valuable insights into various aspects of your online store, such as product performance, shopping behavior, and checkout funnel analysis.
- Use product performance data to optimize your product offerings, pricing strategies, and promotions.
- Analyze the shopping behavior and checkout funnel reports to identify potential barriers to conversion, such as abandoned carts or checkout issues, and implement changes to improve the user experience.
By harnessing the power of Enhanced E-commerce Tracking in Google Analytics, you can gain a deeper understanding of your online store’s performance and make data-driven decisions for optimization. Keep experimenting with different tracking setups and analyzing your data to uncover new opportunities for growth and improvement. Enhanced E-commerce Tracking mastery, here we come!
Integrating Google Analytics with Other Tools
Google Analytics is an incredibly powerful tool on its own, but when integrated with other platforms and tools, it becomes even more valuable for your online business. By combining data from various sources, you can gain a more holistic view of your website’s performance and make better-informed decisions. Let’s explore the benefits of integrating Google Analytics with other tools and how to make the most of these integrations.
A. Benefits of Tool Integration
- Comprehensive insights: Combining data from multiple tools provides a more complete picture of your website’s performance and user behavior.
- Streamlined workflows: Integrations can help automate data sharing and analysis, saving you time and effort.
- Enhanced decision-making: Accessing data from multiple sources allows for better-informed decisions and more effective strategies.
B. Popular Google Analytics Integrations
- Google Ads: Link your Google Analytics and Google Ads accounts to analyze the performance of your ad campaigns, track conversions, and optimize your marketing efforts.
- Google Search Console: Integrate Google Search Console data with Google Analytics to gain insights into organic search performance, such as click-through rates, impressions, and landing page performance.
- CRM platforms (e.g., Salesforce, HubSpot): Connect your CRM with Google Analytics to better understand customer behavior, segment your audience, and personalize your marketing campaigns.
- E-commerce platforms (e.g., Shopify, WooCommerce): Integrate your e-commerce platform with Google Analytics to track sales, revenue, and product performance data.
C. Setting up Integrations
- Research the integration process for each tool you wish to connect with Google Analytics, as the steps may vary depending on the platform.
- Follow the instructions provided by the platform or tool to establish a connection with your Google Analytics account.
- Test the integration to ensure accurate data transfer and troubleshoot any issues that may arise.
By integrating Google Analytics with other tools and platforms, you can unlock new levels of insight and make better decisions for your online business. Keep exploring different integration possibilities to find the perfect combination of tools for your needs. Integration mastery, here we come!
Data Visualization and Analysis Tools
Data is an invaluable resource for any online business, but making sense of vast amounts of data can be challenging. That’s where data visualization and analysis tools come in! By creating easy-to-understand visual representations of your data, you can gain insights more quickly and make better-informed decisions. Let’s explore some popular data visualization and analysis tools that work well with Google Analytics and how to make the most of them.
A. Benefits of Data Visualization and Analysis Tools
- Simplified data interpretation: Visual representations make it easier to understand complex data sets and identify trends.
- Efficient analysis: Data visualization tools can save time and effort by automating the analysis process.
- Improved decision-making: Clear insights derived from data visualization can lead to better-informed strategies and actions.
B. Popular Tools for Google Analytics Data Visualization and Analysis
- Google Data Studio: A free, easy-to-use tool from Google that allows you to create custom reports and dashboards by connecting to your Google Analytics data.
- Tableau: A powerful data visualization platform that can integrate with Google Analytics to create in-depth, interactive visualizations and dashboards.
- Microsoft Power BI: A business analytics service that offers seamless integration with Google Analytics, enabling users to create and share detailed visual reports and dashboards.
- Klipfolio: A cloud-based dashboard platform that connects to Google Analytics and other data sources, allowing you to build real-time, interactive dashboards.
C. Getting Started with Data Visualization and Analysis Tools
- Determine your needs: Identify the specific data analysis and visualization requirements for your online business.
- Choose the right tool: Based on your needs, select the most suitable tool from the options listed above or research additional tools that might better suit your requirements.
- Connect your Google Analytics data: Follow the instructions provided by the chosen tool to establish a connection with your Google Analytics account.
- Customize your visualizations: Experiment with different visualization types, filters, and customizations to create insightful, actionable reports and dashboards.
By leveraging data visualization and analysis tools with Google Analytics, you can transform raw data into meaningful insights that drive better decisions for your online business. Keep experimenting with different tools and visualization techniques to find the perfect combination for your needs. Data visualization and analysis mastery, here we come!
Conclusion
As we’ve explored throughout this article, Google Analytics offers a treasure trove of insights into your website’s performance and user behavior. By unlocking its full potential through advanced techniques and tool integrations, you can gain a deeper understanding of your data and make better-informed decisions to grow your online business.
In summary, we’ve covered:
- The importance of advanced segmentation and attribution modeling.
- The power of multi-channel funnels, custom reports, and dashboards.
- The benefits of advanced event tracking and enhanced e-commerce tracking.
- Integrating Google Analytics with other tools and platforms.
- The value of data visualization and analysis tools.
By applying the advanced techniques and strategies discussed in this article, you can take your Google Analytics expertise to the next level and uncover valuable insights that drive growth and improvement. Remember, the key to success is continuous learning and experimentation, so keep exploring new features, integrations, and visualization techniques to stay ahead of the curve.
Now, armed with your newfound knowledge, it’s time to dive into your Google Analytics data and unlock its full potential. Advanced Google Analytics mastery, here you come!


